2025 damage reports; CGA 2025 Data Summary & Trends
CGA submitted damage reports across the U.S. and Canada, with unique events, known causes and combined work categories kept separate. Not a fence-project accident rate.
Sources and scope checked .
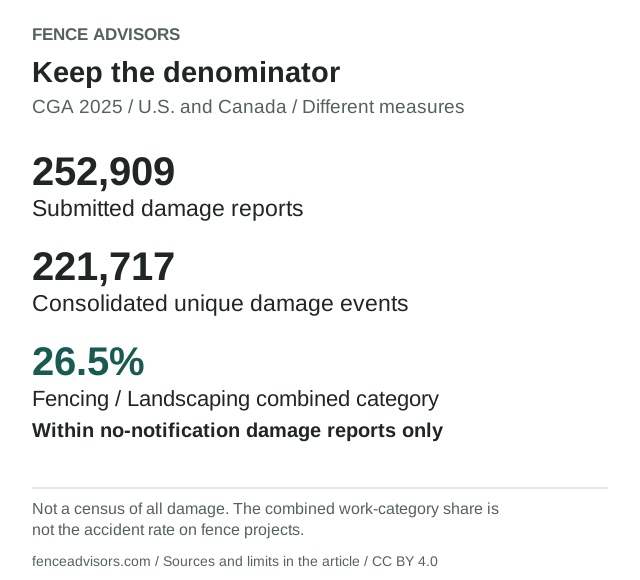
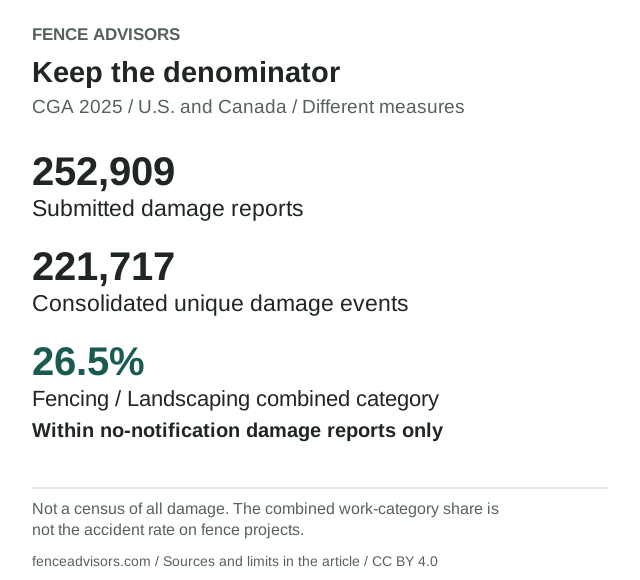
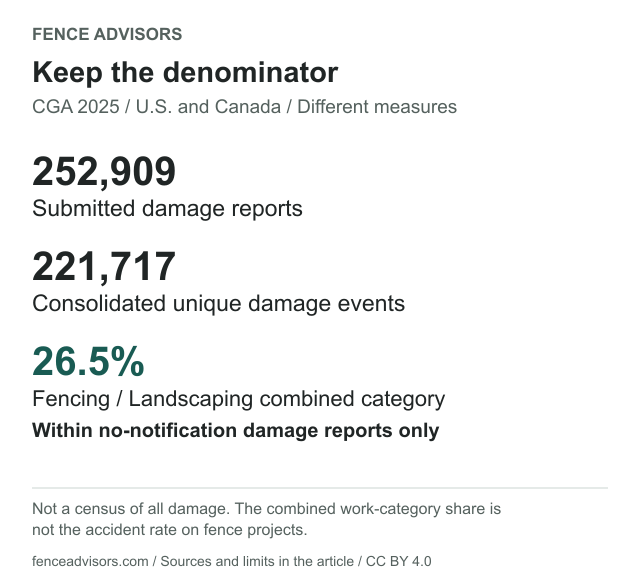
CGA's 2025 DIRT summary lists 252,909 submitted damage reports and 221,717 consolidated unique damage events across the United States and Canada. Within damage reports attributed to no notification to 811, the combined Fencing/Landscaping work category accounts for 26.5%. It does not mean 26.5% of fence projects hit a utility. CGA source slides; known-cause scope.
For practical project preparation, see the 811 and digging guide. Reported damage patterns do not replace your state's notification, response, tolerance-zone or ticket-validity requirements.
Utility damage statistics at a glance
| Geography | Damage reports | Unique damage events | Near-miss reports | Unique near misses |
|---|---|---|---|---|
| United States | 245,129 | 213,985 | 2,575 | 2,415 |
| Canada | 7,780 | 7,732 | 482 | 468 |
| Combined | 252,909 | 221,717 | 3,057 | 2,883 |
Source: CGA 2025 Total Damages & Near Misses table. Unique counts consolidate multiple reports of the same occurrence. These are submitted records, not a census of every damage or a count of all digging jobs. Near misses remain a separate category rather than being added to damage totals.
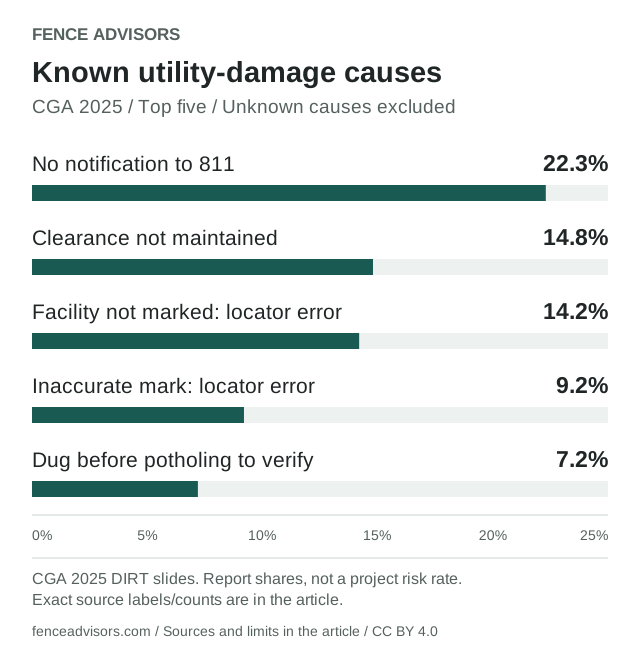
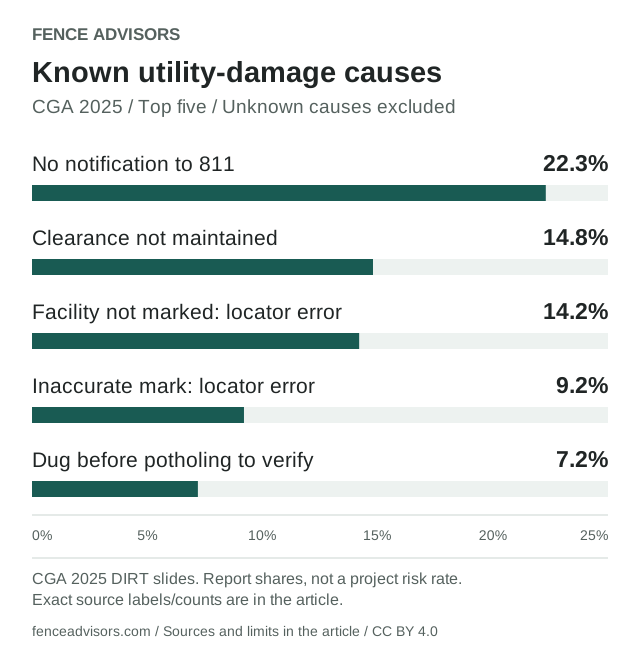
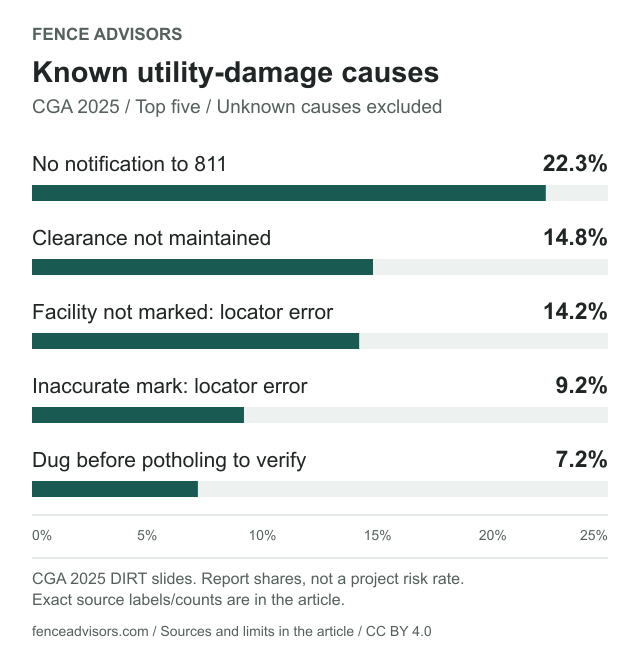
Leading known damage root causes
Download or embed this graphic
<figure>
  <a href="https://fenceadvisors.com/blog/underground-utility-damage-statistics"><img src="https://fenceadvisors.com/media/research/utility-damage-root-causes.svg" alt="The five leading CGA 2025 known root-cause report shares are 22.3%, 14.8%, 14.2%, 9.2% and 7.2%; records with Unknown causes are excluded." width="640" height="650" loading="lazy" style="max-width:100%;height:auto"></a>
  <figcaption>Graphic: <a href="https://fenceadvisors.com/blog/underground-utility-damage-statistics">Fence Advisors</a>. Source, period and limitations are in the linked article. Original graphic: CC BY 4.0.</figcaption>
</figure>| Known cause | Reports | Published share |
|---|---|---|
| No notification made to One Call Center/811 | 35,030 | 22.3% |
| Excavator failed to maintain clearance after verifying marks | 23,240 | 14.8% |
| Facility not marked due to locator error | 22,342 | 14.2% |
| Marked inaccurately due to locator error | 14,392 | 9.2% |
| Excavator dug prior to verifying marks by potholing | 11,340 | 7.2% |
| Improper excavation practice not listed elsewhere | 9,698 | 6.2% |
| Facility not marked due to no response from operator/contract locator | 6,607 | 4.2% |
| Excavator dug outside area described on ticket | 4,753 | 3.0% |
| Excavator failed to shore excavation/support facilities | 4,186 | 2.7% |
| Excavator dug after valid ticket expired | 3,414 | 2.2% |
| Top ten | 135,002 | 86.0% |
Source: CGA 2025 slides, known-cause tables. The complete selected 25-row excerpt is downloadable below. Unknown causes are excluded from this denominator. Published percentages are retained; rounding is not silently normalized. Do not divide the 35,030 no-notification reports by the 221,717 unique-event total to replace the source's 22.3%.
What the fencing and landscaping number means
Download or embed this graphic
<figure>
  <a href="https://fenceadvisors.com/blog/underground-utility-damage-statistics"><img src="https://fenceadvisors.com/media/research/utility-damage-denominators.svg" alt="2025 DIRT totals are 252,909 damage reports and 221,717 unique damage events in the U.S. and Canada. Fencing/Landscaping's 26.5% is within no-notification damage reports, not within all fence projects." width="640" height="580" loading="lazy" style="max-width:100%;height:auto"></a>
  <figcaption>Graphic: <a href="https://fenceadvisors.com/blog/underground-utility-damage-statistics">Fence Advisors</a>. Source, period and limitations are in the linked article. Original graphic: CC BY 4.0.</figcaption>
</figure>
The source's work-performed table assigns 26.5% of no-notification damage reports to Fencing/Landscaping. It combines two activities. It is not a fence-contractor-only count, the industry's share of all damages, or an accident probability per fence installation. Work Performed by Top 10 Known Root Causes.
Three questions require three different datasets: how many reports were submitted; how many distinct events they describe; and how often damage occurs per excavation/project. DIRT's reported work mix answers the first two kinds of questions, not a fence-project risk rate. We do not invent the missing denominator by using directory listings or national fence employment.
Hand tools also appear in damage records
| Equipment | Published rounded share of records with known equipment |
|---|---|
| Backhoe | 46% |
| Hand tools | 24% |
| Boring | 12% |
| Directional drilling | 7% |
| Trencher | 3% |
| Auger | 3% |
Source: CGA 2025 Known Equipment Type chart. Smaller equipment categories remain in the downloadable excerpt. The full rounded chart sums to 99%, not exactly 100%. These shares do not establish comparative risk per use: the report does not provide equal denominators for how often each tool was used.
The practical implication is narrower: small or hand-operated tools do not make notification and safe excavation irrelevant. CGA also associates hand-tool damage with fencing work in its source analysis, but we do not turn that association into a causal risk multiplier for every hand-dug post hole.
Keep 2024 context separate from 2025 observations
Older articles can still cite the 2024 DIRT report, but those figures must remain dated. Its combined fencing/landscaping share within no-notification damage reports was described as 28%; this reference uses the checked 2025 value of 26.5%. That difference alone does not prove a safer fence industry: the reporting population and composition can change. 2024 work-specific analysis; 2025 slides.
Likewise, a raw increase in unique-event counts is not automatically a national incidence trend. Use CGA's dedicated trend methodology if evaluating changes; do not derive a clean growth story from unmatched counts.
Put the evidence into a project record
In a written quote, identify who submits the excavation ticket, confirms positive responses, protects marks, handles unmarked private lines and stops work for unresolved conflicts. These are scope questions, not a substitute for the actual rules or locator instructions. CGA state resources.
The buyer checklist has a utility-locating field. Keep the footing quantity calculation downstream of an approved location/design; a concrete estimate does not authorize digging. Find local fence contractors and ask for their written procedure rather than a verbal assumption that 811 has been handled.
Methodology and citation
Fence Advisors reviewed all 29 pages of the source slide file and the current explanatory web pages on October 3, 2026. The downloadable compilation includes country report/event totals, all 25 known cause rows, the combined-category 26.5% figure and the rounded equipment table. Every measure retains its period, source and denominator; no original accident survey is claimed.
Suggested citation: Fence Advisors, Underground Utility Damage Statistics, October 3, 2026, using Common Ground Alliance 2025 DIRT Data Summary & Trends. Cite CGA as the underlying source and retain the combined work category and known-cause scope.
Frequently Asked Questions
How many utility damages were reported in 2025?
The checked CGA summary lists 252,909 damage reports describing 221,717 consolidated unique events across the U.S. and Canada. Reports and events are different measures, not a census of all damage.
Do fence contractors cause 26.5% of all utility damage?
That is not what the cited statistic says. Fencing/Landscaping is a combined category representing 26.5% within no-notification damage reports. It is not all damages or the probability of damage on a fence project.
Does using a hand shovel avoid the need to contact 811?
Do not assume that. Hand tools appear in reported damage records. Follow the applicable notification and safe-excavation rules and address private facilities separately.
Sources and Downloads
- CGA 2025 DIRT Data Summary & Trends slides
- CGA 2025 at-a-glance and denominator notes
- CGA 2025 root-cause summaries
Original Fence Advisors graphics, data compilations and worksheet are available under CC BY 4.0. Retain source, period and scope when reusing data. This license does not relicense third-party documents or trademarks.
Corrections: editorial@fenceadvisors.com.
Related Research
Put your research to work
Estimate your budget, then compare fence companies in your area.
Get the next guide in your inbox
Fence costs, rankings, and what AI is telling homeowners — researched, no fluff.