May 2025
U.S. wage-and-salary fence erectors (SOC 47-4031). Not a count of fence businesses, owners, or industry revenue.
Sources and scope checked .
BLS estimated 24,480 U.S. wage-and-salary fence erector jobs in May 2025, with a $23.07 median hourly wage and $24.29 mean hourly wage. These are occupation statistics, not a count of fence contractors, a market-size estimate, or an installation price. Source: BLS May 2025 profile.
This reference brings together the useful fence-industry employment statistics, explains their limits, and provides original charts and reusable data. It was published in 2026; the observations are from May 2025. No new Fence Advisors survey is claimed.
Fence industry statistics at a glance
| Statistic | Value | What it measures |
|---|---|---|
| U.S. fence erector employment | 24,480 | Estimated wage-and-salary jobs, SOC 47-4031 |
| Median hourly wage | $23.07 | The occupation's 50th percentile |
| Mean hourly wage | $24.29 | The occupation's average |
| Median annual wage | $47,980 | BLS annualized wage estimate |
| Mean annual wage | $50,530 | BLS annualized mean wage |
| Largest published state estimate | California: 3,150 | Jobs, not company count or sales |
| Five largest state estimates combined | 9,570 (39.1%) | Calculation using published estimates |
Source: BLS May 2025 occupation profile. The combined share is Fence Advisors arithmetic on published, rounded employment estimates.
What counts as a fence erector?
SOC 47-4031, Fence Erectors, covers workers erecting and repairing fences and gates. It is a job classification, not every person or business in the fencing economy. Manufacturers, distributors, estimators and supervisors can be classified elsewhere. BLS occupation definition.
OEWS excludes self-employed workers and owners and partners in unincorporated firms. Consequently, 24,480 is not everyone working in fencing and is not the number of unique contractors. The estimate combines six semiannual survey panels; it is not a simple headcount census taken in May. BLS technical note.
Fence installer wage statistics and percentiles
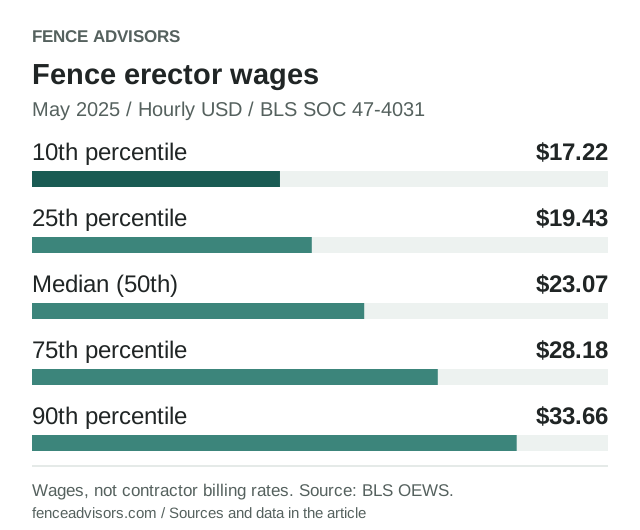
Download or embed this graphic
<figure>
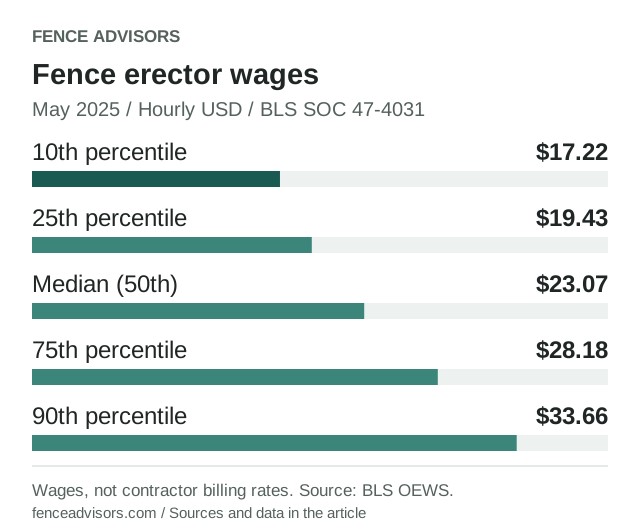
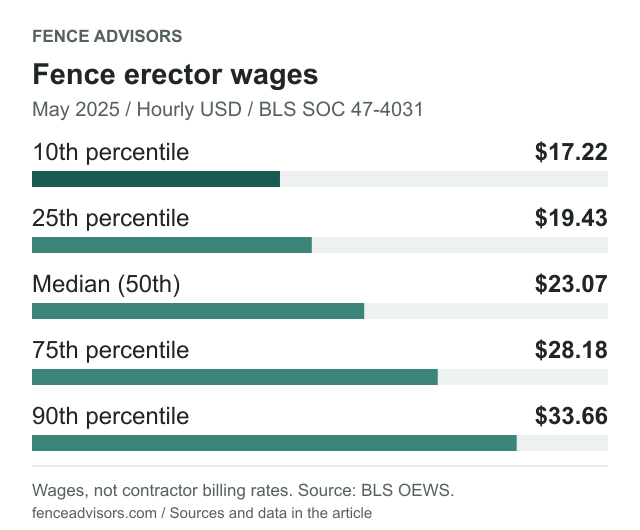
  <a href="https://fenceadvisors.com/blog/fence-industry-statistics"><img src="https://fenceadvisors.com/media/research/fence-erector-wage-percentiles.svg" alt="BLS May 2025 fence erector hourly wages: 10th percentile $17.22, 25th $19.43, median $23.07, 75th $28.18 and 90th $33.66." width="640" height="530" loading="lazy" style="max-width:100%;height:auto"></a>
  <figcaption>Graphic: <a href="https://fenceadvisors.com/blog/fence-industry-statistics">Fence Advisors</a>. Source, period and limitations are in the linked article. Original graphic: CC BY 4.0.</figcaption>
</figure>| Wage percentile | Hourly wage | Annual wage |
|---|---|---|
| 10th | $17.22 | $35,810 |
| 25th | $19.43 | $40,400 |
| 50th (median) | $23.07 | $47,980 |
| 75th | $28.18 | $58,610 |
| 90th | $33.66 | $70,010 |
Source: BLS May 2025 wage percentiles. A percentile describes the wage distribution, not a guaranteed starting salary, a certification or a contractor's labor charge.
The $23.07 median describes the middle of the distribution; the $24.29 mean is an average. Label them explicitly when citing an average fence installer salary. Published annual wages generally use 2,080 hours; they do not show that every installer worked those hours in a seasonal year. OEWS wages exclude overtime premiums and employer benefit costs. BLS concepts.
Why wages are not installation prices
A contractor's quote also pays for materials, equipment, insurance, overhead and non-billable time. Multiplying this wage by an assumed installation time does not produce a measured national fence price.
Use the cost per foot guide and cost calculator for planning ranges, then compare real bids with the quote comparison worksheet.
Fence employment statistics by state
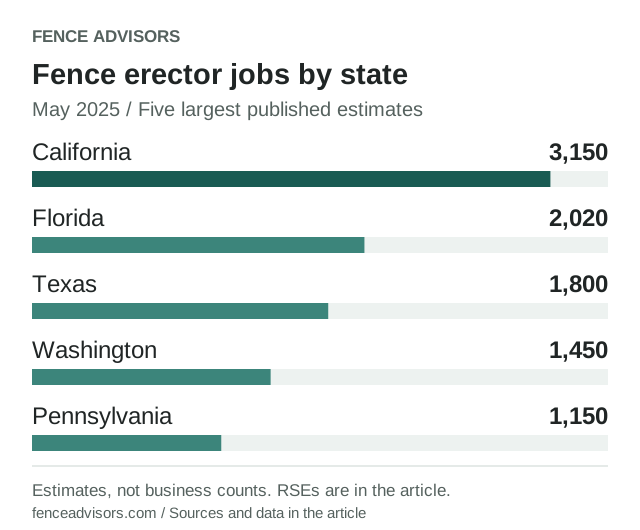
Download or embed this graphic
<figure>
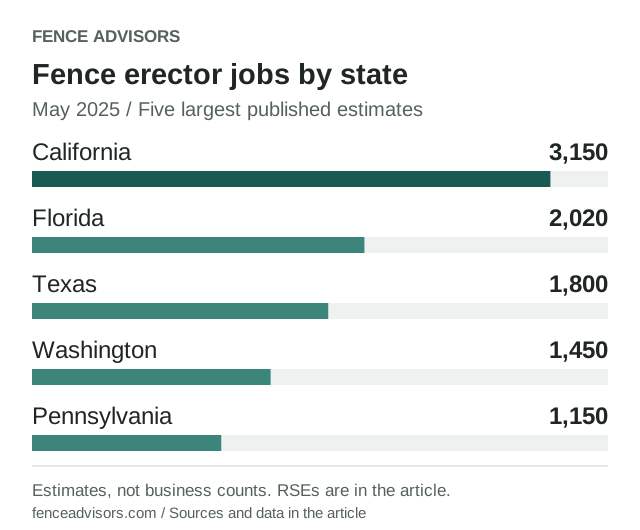
  <a href="https://fenceadvisors.com/blog/fence-industry-statistics"><img src="https://fenceadvisors.com/media/research/fence-erector-employment-states.svg" alt="May 2025 fence erector jobs: California 3,150; Florida 2,020; Texas 1,800; Washington 1,450; Pennsylvania 1,150." width="640" height="530" loading="lazy" style="max-width:100%;height:auto"></a>
  <figcaption>Graphic: <a href="https://fenceadvisors.com/blog/fence-industry-statistics">Fence Advisors</a>. Source, period and limitations are in the linked article. Original graphic: CC BY 4.0.</figcaption>
</figure>| State | Fence erector jobs | Share of national estimate | Employment RSE |
|---|---|---|---|
| California | 3,150 | 12.9% | 16.4% |
| Florida | 2,020 | 8.3% | 29.2% |
| Texas | 1,800 | 7.4% | 19.2% |
| Washington | 1,450 | 5.9% | 28.4% |
| Pennsylvania | 1,150 | 4.7% | 30.7% |
Source: BLS May 2025 state table. Shares are calculated as each state's estimate divided by 24,480, multiplied by 100, rounded to one decimal. These are selected top-five estimates, not all states.
Combined, these states account for 9,570 estimated jobs, or 39.1% of the occupation estimate. That is not their share of fence sales, installations, suppliers or businesses.
RSE means relative standard error. Florida's 29.2% employment RSE signals substantial uncertainty, not a missing-worker percentage. Point estimates alone do not establish precise market-opportunity rankings. BLS estimation methodology.
For local contractor research instead, browse California, Florida, Texas, Washington or Pennsylvania. Directory coverage is a different dataset, not a census of statewide businesses.
Major metro fence workforce estimates
| Published metro area | Fence erector jobs | Employment RSE |
|---|---|---|
| New York-Newark-Jersey City, NY-NJ | 1,290 | 28.7% |
| Seattle-Tacoma-Bellevue, WA | 730 | 40.2% |
| Los Angeles-Long Beach-Anaheim, CA | 710 | 19.5% |
| Philadelphia-Camden-Wilmington, PA-NJ-DE-MD | 570 | 23.3% |
| Providence-Warwick, RI-MA | 450 | 43.6% |
Source: BLS May 2025 area profile. These are its five largest published area estimates. A metro can cross city and state boundaries: New York-Newark-Jersey City is not New York City alone; the Philadelphia area is not the city alone.
Relatively large sampling errors limit precise comparisons. These are not contractor rankings, homeowner-demand measurements or local quote surveys. A workforce report answers a different question from a city company directory.
Fence contractor and supplier industry context
| Industry group employing fence erectors | Fence erector jobs | Employment RSE |
|---|---|---|
| Other Specialty Trade Contractors | 19,730 | 6.1% |
| Building Material and Supplies Dealers | 980 | 40.7% |
| Employment Services | 470 | 49.2% |
| Rental and Leasing Services (5322, 5323, and 5324 only) | 410 | 32.5% |
| Building Equipment Contractors | 370 | 28.3% |
Source: BLS May 2025 industry profile. Other Specialty Trade Contractors employs 19,730 fence erectors, approximately 80.6% of the national occupation estimate. The broader industry also includes work beyond fencing.
The 980 fence erector jobs in Building Material and Supplies Dealers are not 980 fence suppliers or all workers at those dealers. Finding material sources is a separate task: use the supplier directory.
What these statistics cannot tell you
- Market revenue or material shares. Employment in one occupation is not sales or the popularity of wood, vinyl, metal or composite.
- The number of fence companies. This is not a business census, and self-employed owners are excluded.
- Year-over-year industry growth. This excerpt uses one reference period and overlapping survey panels, not an annual headcount study.
- An installed price in your city. Wages are one input; the project scope and actual bids matter.
The American Fence Association's Fence Industry Index describes separate market research covering fencing, gates, automation, barriers and railings. Its public overview does not provide an inspectable national revenue table here. We do not fill that gap with an unsupported market-size number.
Methodology and citation
We checked the May 2025 BLS profile and national release table on October 3, 2026, recorded selected observations in the downloadable JSON, and generated tables, CSV and graphics from those inputs. The national employment RSE is 6%; the mean wage RSE is 1.3%. Published rounding is retained.
Coverage is the national occupation, five wage percentiles, and selected top-five state, industry and area rows. For broader analysis, use the official May 2025 workbook and BLS data tables.
Suggested citation: Fence Advisors, Fence Industry Statistics: U.S. Jobs, Wages & State Data, October 3, 2026, using BLS May 2025 OEWS, SOC 47-4031. Keep the observation period and original source; publication in 2026 does not make these 2026 employment observations.
Frequently Asked Questions
How many fence installers are there in the United States?
BLS estimated 24,480 wage-and-salary jobs in the Fence Erectors occupation in May 2025. That excludes self-employed workers and certain owners, and does not cover all fencing-industry occupations.
What is the average fence installer salary?
BLS reported a $24.29 hourly mean and $50,530 annual mean for May 2025. The median was $23.07 hourly and $47,980 annually; annual values generally use 2,080 hours.
Which state has the most fence erector jobs?
California had the largest published May 2025 state point estimate, 3,150 jobs, with 16.4% employment RSE. This is not a precise business census or sales ranking.
Are these fence industry market-size statistics?
No. These are occupation employment and wage estimates, not fence sales, company counts, installed prices or material market shares.
Sources and Downloads
- BLS May 2025 fence erector occupation profile
- BLS May 2025 national employment and wage table
- BLS OEWS technical note
- BLS May 2025 national data download
Original Fence Advisors graphics, data compilations and worksheet are available under CC BY 4.0. Retain source, period and scope when reusing data. This license does not relicense third-party documents or trademarks.
Corrections: editorial@fenceadvisors.com.
Related Research
Put your research to work
Estimate your budget, then compare fence companies in your area.
Get the next guide in your inbox
Fence costs, rankings, and what AI is telling homeowners — researched, no fluff.